Testing manual scaling solutions
Manual Scaling
Manual Scaling is a method of manually managing resource scale in Auto Scaling Groups (ASGs) on AWS. Instead of letting the system automatically adjust the number of resources based on set conditions, you will decide when to add or remove the number of instances (virtual servers) in the group.
Install the test program
Before going into testing, we need to load a test program to simulate the system under high traffic load. First, go to this link to download the test program: https://www.paessler.com/tools/webstress
Test settings
When the Auto Scaling Group is created, this service will automatically initialize an EC2 Instance that we configured earlier. To see this, we can go to EC2 Console
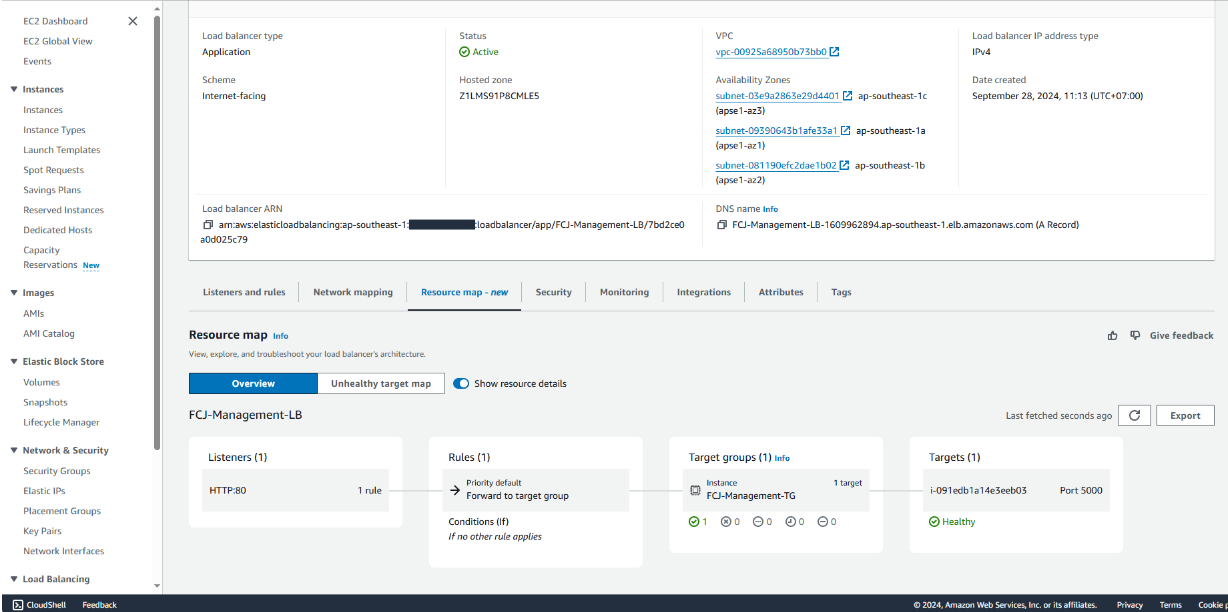
- Select Load Balancer
- Select the Resource map - new tab
Here we can see that the previous Target Group is linked to 2 Targets, which are 2 EC2 Instances (1 is the original instance created earlier; the other is the instance created from ASG).
Test with the application that we downloaded earlier.
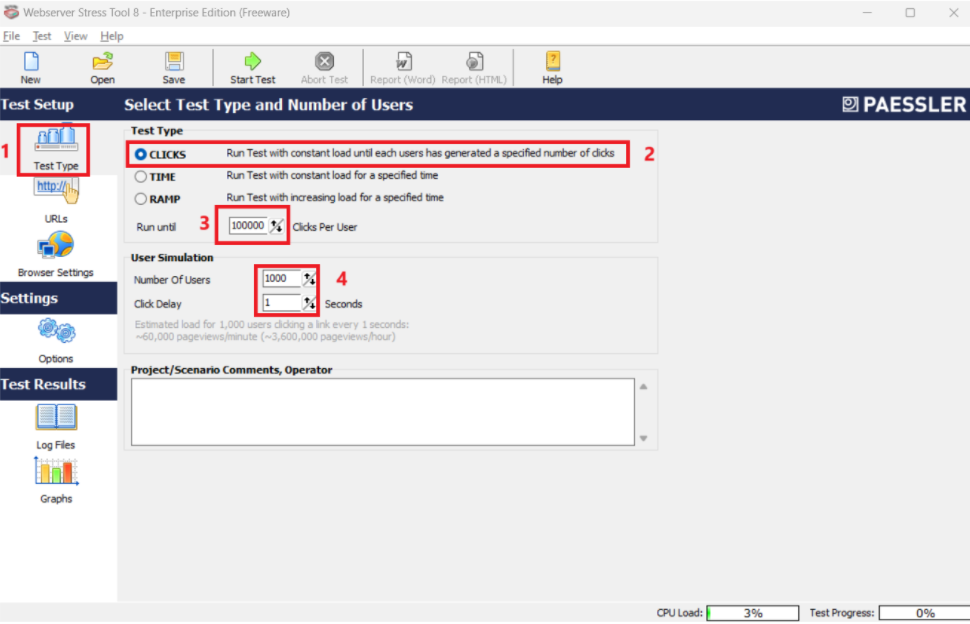
Open the application, click on the Test Type tab
Test Type:
Select CLICKS
Run until: 100000
User Simulation
Number Of Users: 1000
Click Delay: 1 seconds
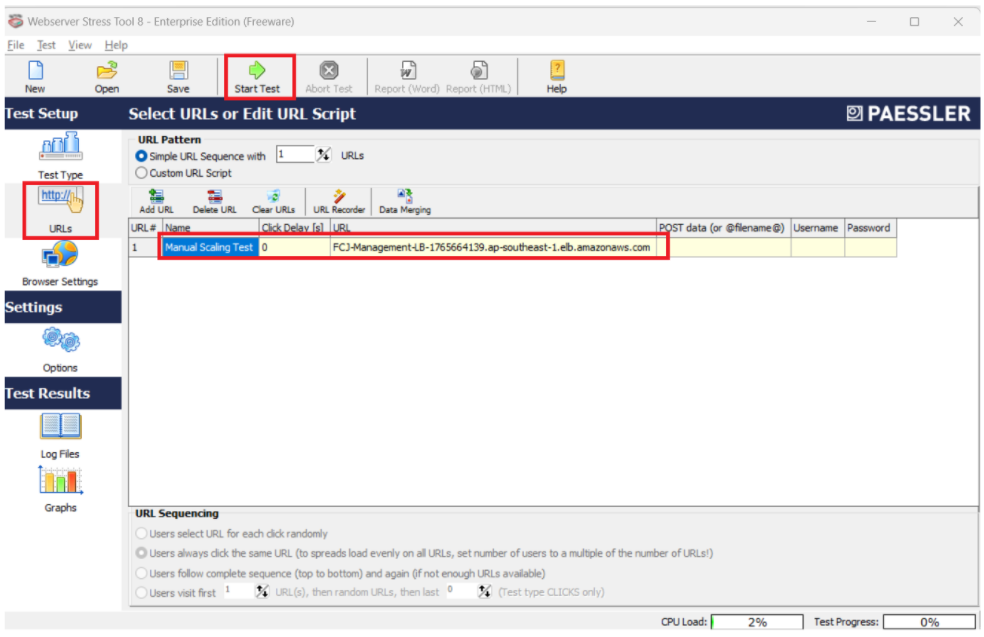
In the URLs tab, I will configure the information
Name:
Manual Scaling Test, here you can set it to whatever, because we will use it to test in other types of scaling later.URL: copy the DNS of the Load Balancer and paste it in.
Start by pressing Start Test
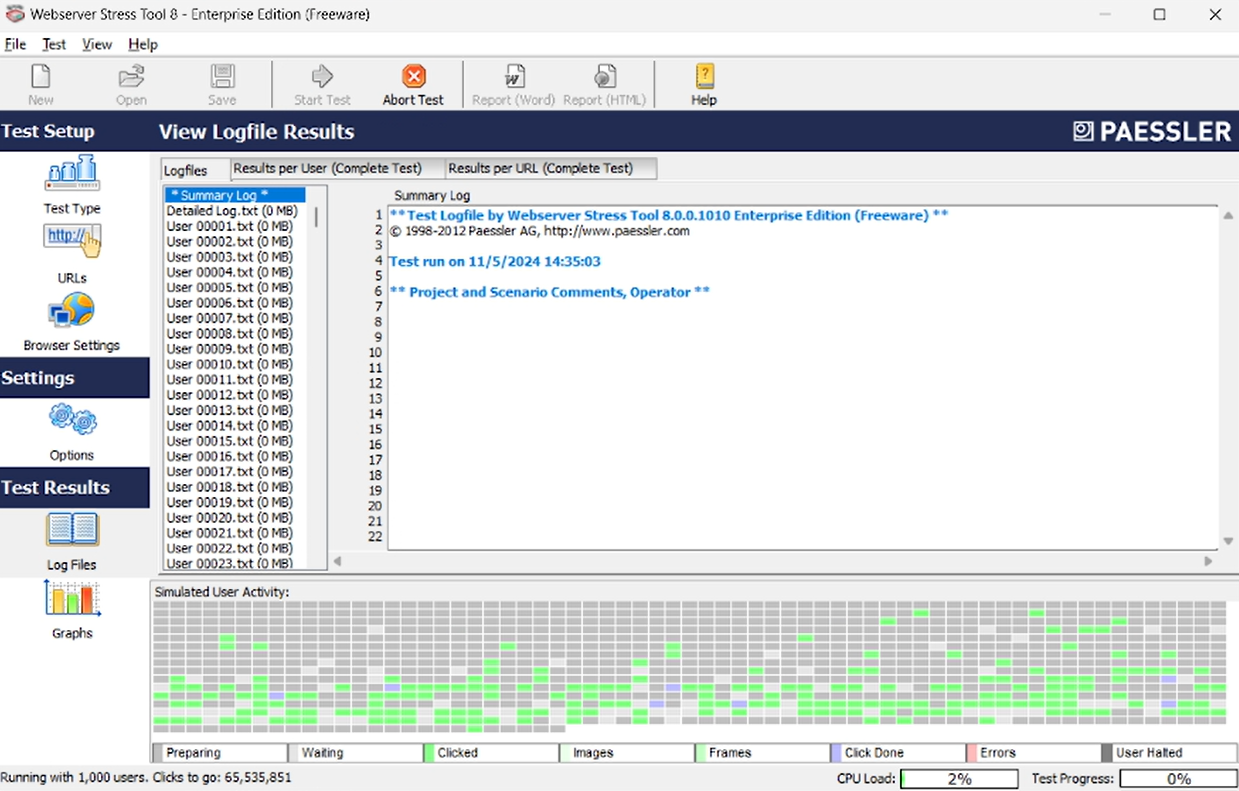
Run the test
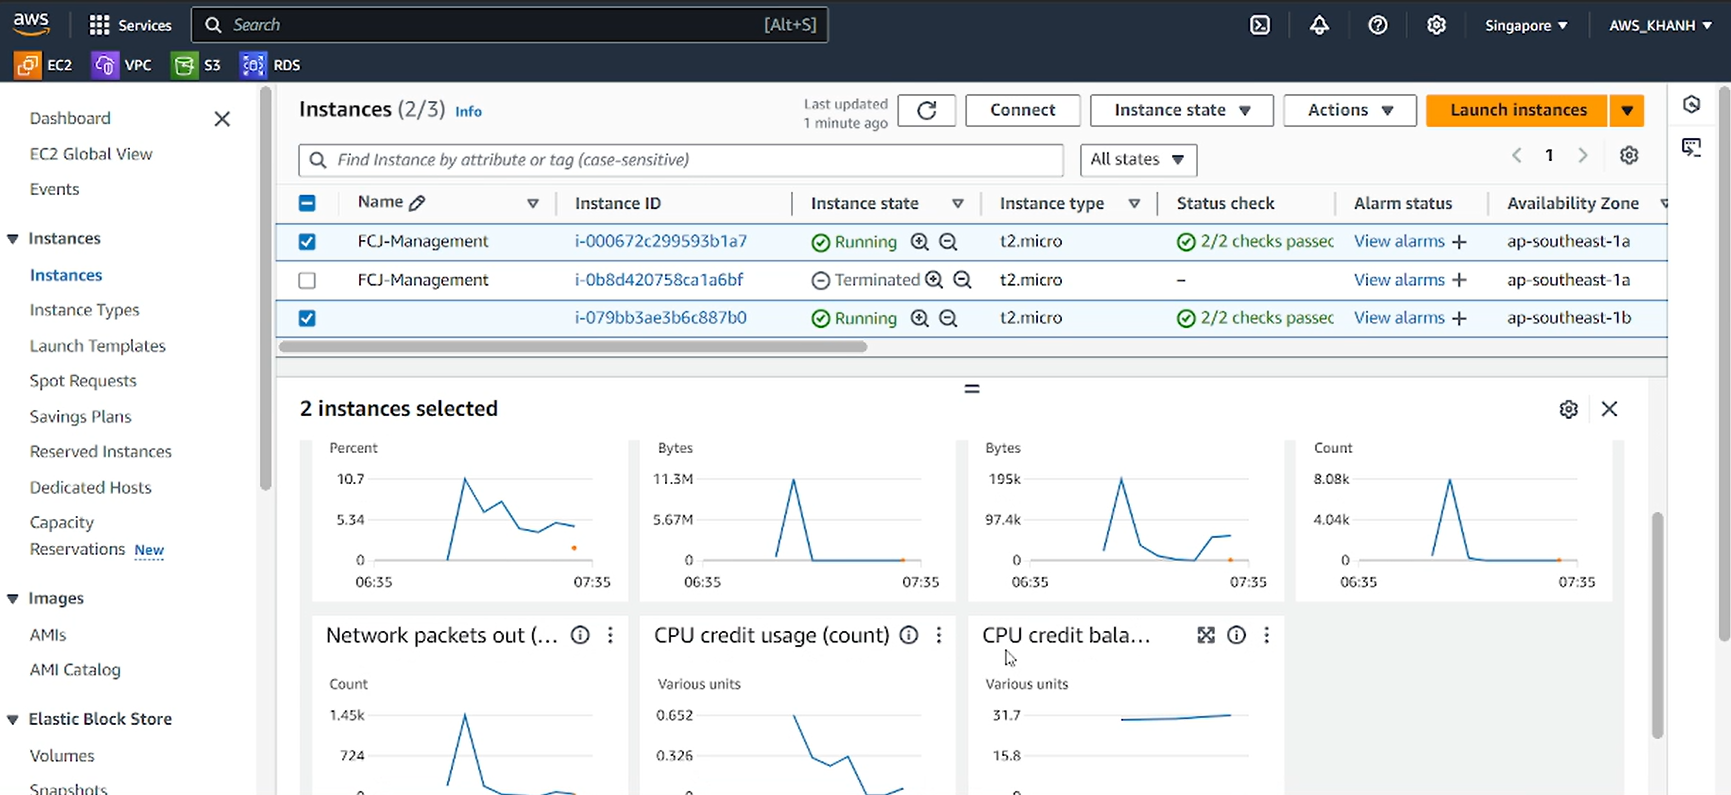
Now go back to AWS Management Console, go to EC2 Console
- Select 2 EC2 Instances in the target group
- Click on Monitoring tab and start observing
In this section, we have 7 charts, but for now we are only interested in the following 5 charts:
CPU Utilization (%): the chart shows the amount of CPU resources that these 2 instances have used in the range of less than 8% for each instance.
Network in (bytes): the chart shows the network capacity going into these 2 instances in the range of less than 2.9 million Megabytes for each instance.
Network out (bytes): the chart shows the network capacity going out from these 2 instances in the range of less than 17.3 million Megabytes for each instance.
Network packets in (count): the graph shows the number of packets entering these 2 instances is around 6.85k packets per instance.
Network packets out (count): the graph shows the number of packets leaving these 2 instances is around 7.36k packets per instance.
From now on, we will read these graphs like this. Including important parameters in the vertical and horizontal columns and drawn lines. From here, we will understand more about how the Load Balancer balances network traffic to the instances in the Target Group.
And if you only select 1 instance, then the graph will only have one drawn line representing that instance. Thus, the more you select on the list, the more lines will be displayed.
Manually adjust the ASG Desired capacity parameter
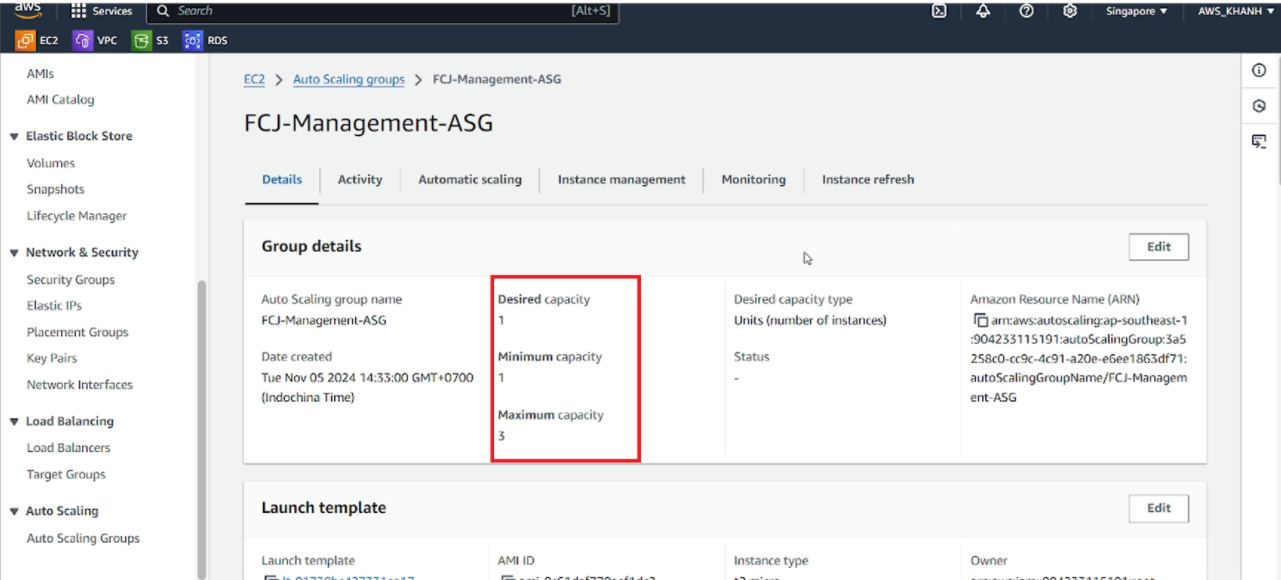
Now we return to the ASG details page that we created earlier. In the Group details section, we can see that: Desired capacity = 1.
Now we will assume a situation, that it is past peak hours so we want to turn off one instance to save costs. To do this, we will manually adjust the Desired capacity = 0 parameter. Click Edit.
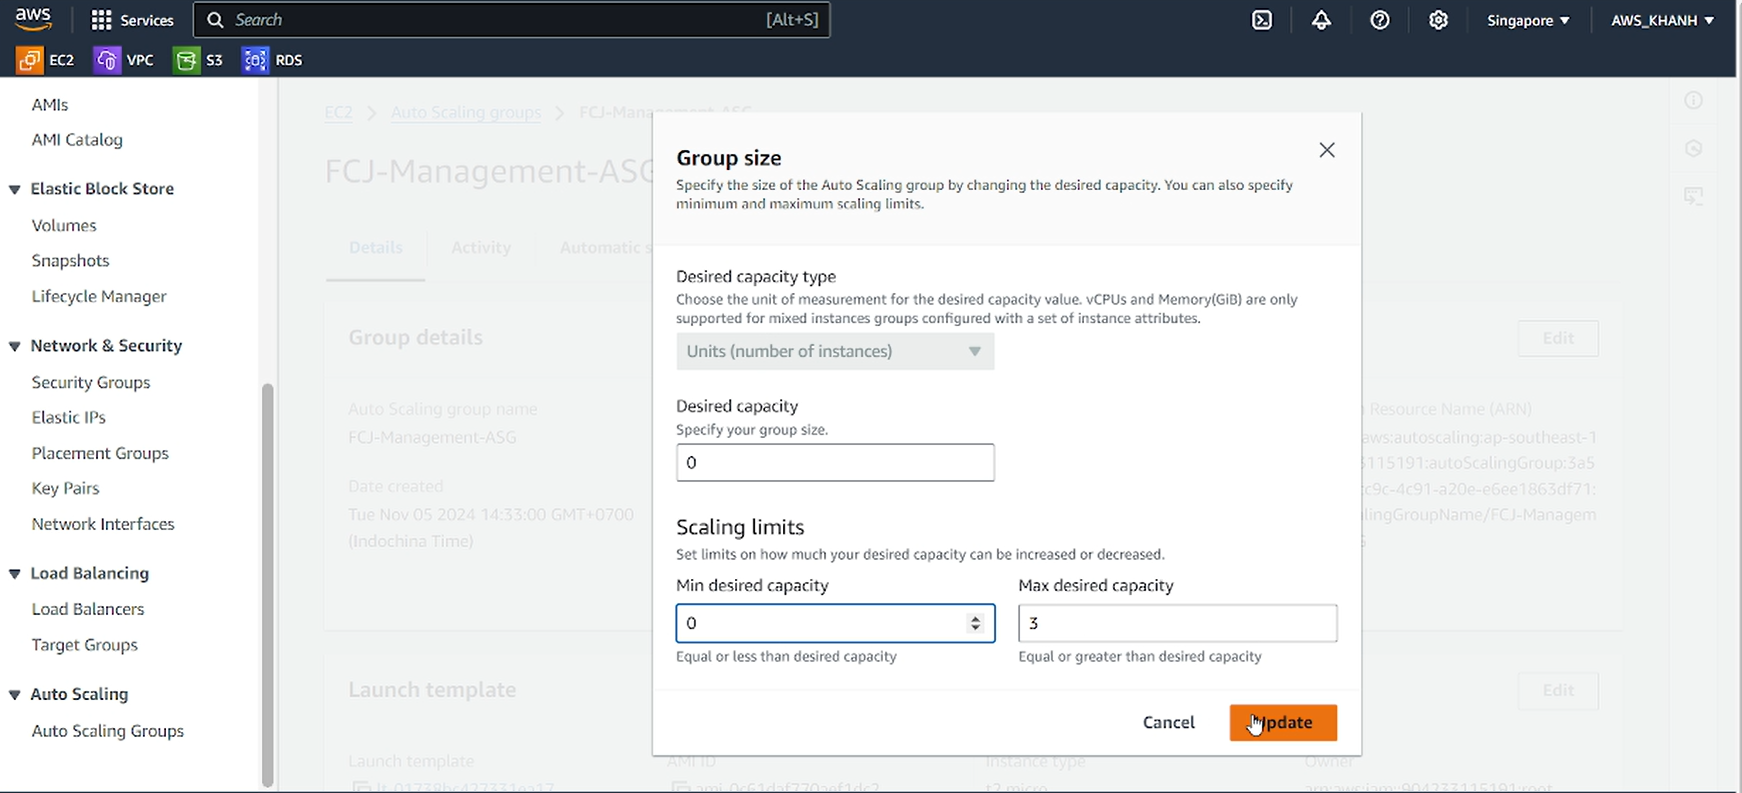
Adjust Desired capacity and Min desired capacity to 0 and click Update.
Then go to the Activity tab to see what ASG is doing.
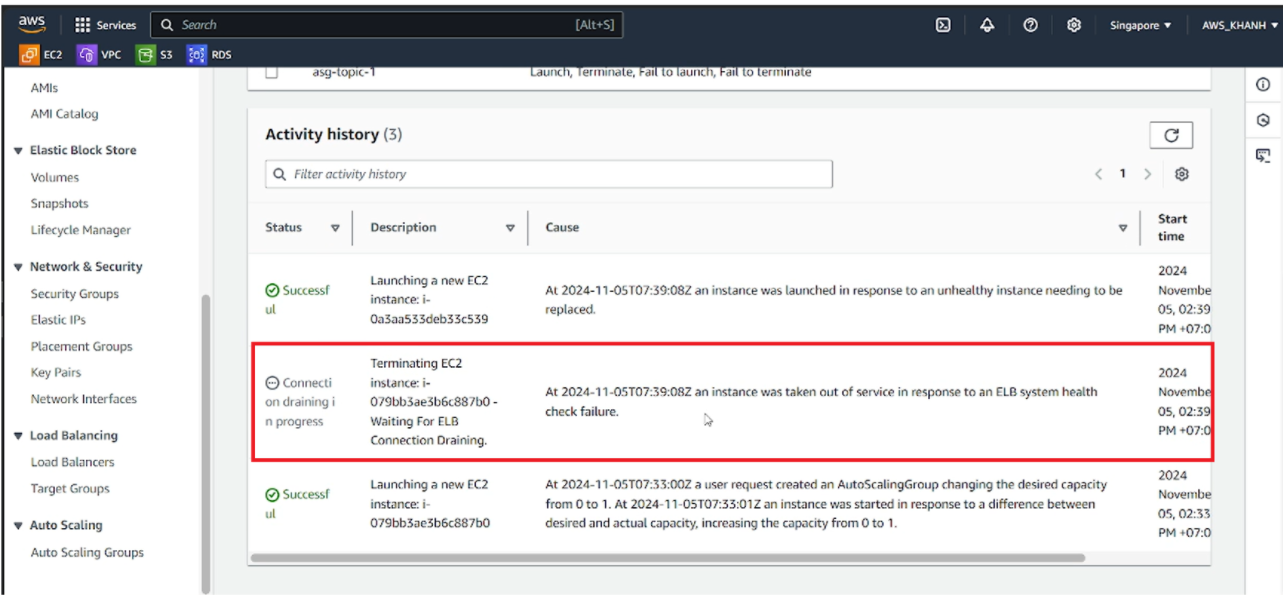
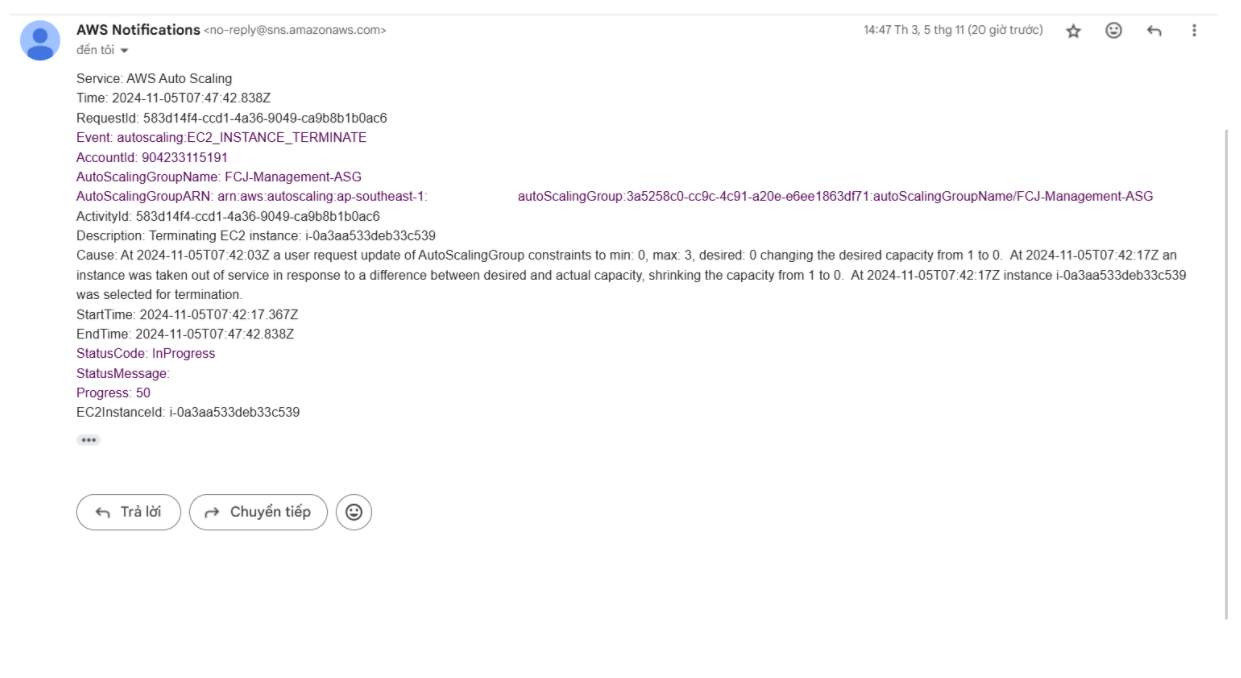
=> So we can see that ASG will automatically destroy an instance according to the parameters it has configured.
A few minutes later, go back to the Load Balancer information page, go to the Resource map - new tab and we can see that there is now only one target left.
RETURN the test program.
We will also receive an email from SNS
It can be seen that the instance has now doubled the incoming and outgoing network traffic and the amount of CPU resources used is almost 4 times higher.
Conclusion
In reality, the systems will have more complex and longer implementation steps, so they will use more CPU resources.